Showing posts with label Database. Show all posts

Monday, October 6, 2025

Explore Docker MCP Toolkit and VS Code

To explore Docker MCP Toolkit, we will use two MCP server in the toolkit, namely PostgreSQL and Playwright.

Companion Video: https://youtu.be/43oJi_gAucU

What is Docker MCP Toolkit?

The Docker MCP Toolkit enables hosting and managing MCP servers. These servers expose APIs for specific development tasks, such as retrieving GitHub issue data or querying databases using natural language.

Prerequisites

You will need the following before you can continue:

  • Docker Desktop (latest version)
  • Visual Studio Code (latest version)
  • GitHub Copilot extension for VS Code
  • GitHub Copilot with Chat and Agent Mode enabled

1) Explore PostgreSQL MCP Server

We will use natural language to query a PostgreSQL database that is already pre-loaded with the sample Northwind database. To run the PostgreSQL server in a docker container on your computer, execute the following command from any terminal window:


docker run --name psqlnw -e POSTGRES_PASSWORD=VerySecret -p 5433:5432 -d melmasry/nw-psql:1.0.0

Start “Docker Desktop” on your computer and go to the Containers tab on the left navigation. You will see that the psqlnw container is running.


Next, let us use the Docker MCP Toolkit. In Docker Desktop, click on “MCP Toolkit” in the left navigation.

Click on the Catalog tab. This will show you a list of MCP Servers that are ready for you to explore. 

We will start with PostgreSQL. Find the PostgreSQL MCP Server by entering ‘postgr’ in the filter field. Then click on + to add it to your list.

You will be asked to enter a secret. This is nothing but the connection string and it is based on this format:

postgresql://readonly_user:readonly_password@host:port/database_name

In our case, this would be:

postgresql://postgres:VerySecret@host.docker.internal:5433/northwind

Click on the "My Servers" tab to see the MCP servers that you have chosen.

Connect Docker MCP Toolkit to Visual Studio Code

Let us query our northwind database in PostgreSQL from VS Code. Go to a working directory and execute these commands to create an empty folder on your computer:

mkdir mcp-server
cd mcp-server

In the same terminal window, logout and login into docker with:

docker logout  
docker login

Start VS Code in the folder with

code .

In VS Code, open the Command Palette by pressing Ctrl + Shift + P (or Cmd + Shift + P on macOS).

Select “Add MCP Server”.

Select “Command (stdio) Run a local command that implements the MCP protocol Manual Install”.

Enter the gateway command:

docker mcp gateway run

Give the server an ID named: 

my-mcp-server

Choose “Workspace Available in this workspace, runs locally”.


Click Trust.

A file named mcp.json is created in a .vscode folder with this content:

Note that the server is running. 

Inside the Github Copilot Chat window, choose Agent and any Claude model. Click on the tools icon to see active MCP servers.

You will find MCP servers that are configured in VS Code. Among them will be the one we enabled in the Docker MCP Toolkit.

You will notice that it only has one tool: “query Run a read-only SQL query”. This is all that is needed to query the northwind database.

Click ok the Ok button to close the tools popup.

Enter this prompt in the GitHub Copilot window:

What are the tables in the PostgreSQL northwind database?

You will be asked to click on the Allow button.

Thereafter, it displays a list of database tables in the northwind database.

Try this other prompt:

What are the products supplied by "Exotic Liquids"?

You will get a similar response to this:

2) Explore Playwright MCP Server

Back in Docker Desktop >> MCP Toolkit, add Playwright.

You now have two MCP servers in our list: Playwright and PostgreSQL.

Back in VS Code, restart the MCP Server in the .vscode/mcp.json file.

In the VS Code GitHub Copilot Chat window, enter this prompt:

Using the tools provided from the Docker MCP Server, navigate to https://www.bbc.com/, find the two most important business stories.

I got the following response at the time of writing this article:

Conclusion

I hope you found this article useful. These are early days of MCP servers. I am sure things will evolve much more in this very important space.

Wednesday, February 9, 2022

PHP, SQLite, CSV and CanvasJS

In this article, I will import data from a CSV file into SQLite and render a chart using Canvas.JS. The purpose of this post is to familiarize the reader with importing a CSV file into a database and, subsequently, rendering a pie chart with the data.

Source Code: https://github.com/medhatelmasry/php_chart

The following is assumed:

  • You have PHP installed on your computer
  • You have the "extension=sqlite3" setting enabled in your php.ini.

Directory Structure

Inside of a working directory named php_chart, create the following directory structure:

The home page

Inside the root folder, add an index.html file with the following content representing a simple menu system:

<p><a href="./create" >Create school database and students table in SQLite.</a></p>
<p><a href="./import/" >Import seed data from csv file.</a></p>
<p><a href="./list/" >List data</a></p>
<p><a href="./chart/" >Display chart with Canvas.JS</a></p>

Sample data

Inside the data folder, create a text file named seed-data.csv with data from this link.

The database file

In the root of your application, create a PHP file named include_db.php containing only one statement, representing the name of the database file:

<?php
$db = new SQLite3($_SERVER['DOCUMENT_ROOT'] . '/school.db');
?>

The above code creates a school.db SQLite database file if it does not already exist.

Creating database file and add Students table

Add an index.php file inside the create folder with the following content:


<?php include("../include_db.php"); ?>

<?php
echo "<hr /><h3>Create Student Table</h3>";
#===============================================
# Create table
#===============================================

$SQL_create_table = "CREATE TABLE IF NOT EXISTS Students (
    StudentId VARCHAR(10) NOT NULL,
    FirstName VARCHAR(80),
    LastName VARCHAR(80),
    School VARCHAR(50),
    PRIMARY KEY (StudentId)
);";

echo "<p>$SQL_create_table</p>";

$db->exec($SQL_create_table);

$db->close();
?>

<hr /><a href="/" >&lt;&lt; BACK</a>

What does the above code do?

  • We first include the include_db.php file so that we have a handle to the db object representing our school.db database file.
  • Next, we create a Students table in the database by executing a "Create Table ..." SQL statement. The columns in the table match the items in our CSV file.
  • We close the connection to the database.
  • There is a link at the bottom that returns us to the home page.

Import CSV file into Students table

Add an index.php file inside the import folder with the following content:

<?php include('../include_db.php'); ?>

<?php
    $count = $db->querySingle("SELECT count(*) from Students");

    // if empty, insert sample data
    if ($count == 0) {
        $row = 1;
        if (($handle = fopen("../data/seed-data.csv", "r")) !== FALSE) {
            $data = fgetcsv($handle, 1000, ",", "\"", "\\");
            while (($data = fgetcsv($handle, 1000, ",", "\"", "\\")) !== FALSE) {
                
                $num = count($data);
                echo "<p> $num fields in line $row: <br /></p>\n";
                $row++;
        
                $id = SQLite3::escapeString($data[0]);
                $firstName = SQLite3::escapeString($data[1]);
                $lastName = SQLite3::escapeString($data[2]);
                $school = SQLite3::escapeString($data[3]);
        
                $SQLinsert = "INSERT INTO Students (StudentId, FirstName, LastName, School)";
                $SQLinsert .= " VALUES "; 
                $SQLinsert .= " ('$id', '$firstName', '$lastName', '$school')";

                $db->exec($SQLinsert);
                $changes = $db->changes();
                echo "<p>The INSERT statement added $changes rows</p>";
            }
        }
    } 
    $db->close();
?>

<hr /><a href="/" >&lt;&lt; BACK</a>


What does the above code do?

  • We check whether or not there is any data in the Students table.
  • We load data from the CSV file only if the Students table is empty
  • The PHP fgetcsv() function is used to load CSV data into an array named $data
  • Every row of data in the CSV file is inserted into the Students table in the database
  • We close the connection to the database.

List imported students data

Add an index.php file inside the list folder with the following content:


<?php include("../include_db.php"); ?>

<table border="1">
<?php 

echo "<hr /><h3>List of students</h3>";

$res = $db->query('SELECT * FROM Students');

while ($row = $res->fetchArray()) {
    echo "<tr>\n";
    echo "<td>{$row['StudentId']}</td>";
    echo "<td>{$row['FirstName']}</td>";
    echo "<td>{$row['LastName']}</td>";
    echo "<td>{$row['School']}</td>";
    echo "<tr>\n";
}

?>
</table>
<hr /><a href="/" >&lt;&lt; BACK</a>

What does the above code do?

The above code simply lists the contents of the Students in an html table.

Render a pie chart of  "student count by school"

Add an index.php file inside the chart folder with the following content:

<?php include('../include_db.php'); ?>

<?php
$dataPoints = [];

$sql = "SELECT School as school, COUNT(*) as count";
$sql .= " FROM Students GROUP BY School";
$res = $db->query($sql);

while ($row = $res->fetchArray()) {
  $arrayItem = array("label" => $row['school'], "y" => $row['count']);
  array_push($dataPoints, $arrayItem);
}

$db->close();
?>

<script>
window.onload = function() {
  var chart = new CanvasJS.Chart("chartContainer", {
    animationEnabled: true,
    title: {text: "Students by school"},
    data: [{
      type: "pie",
      yValueFormatString: "#,##0.00\"\"",
      indexLabel: "{label} ({y})",
      dataPoints: <?php echo json_encode($dataPoints, JSON_NUMERIC_CHECK); ?>
    }]
  });
  chart.render();
}
</script>
<div id="chartContainer" style="height: 370px; width: 100%;"></div>
<script src="https://canvasjs.com/assets/script/canvasjs.min.js"></script>

<hr /><a href="/" >&lt;&lt; BACK</a>

What does the above code do?

  • A "SELECT ... GROUP BY ..." SQL statement is executed that generates a result-set containing  count of students by school.
  • A two-dimensional array is created with key "label" containing school and key "y" containing count
  • The bottom part of the above code used the CanvasJS JavaScript library
  • The type property is set to the type of chart you wish to generate. In this case it is pie.
  • The dataPoints property contains our data from the $dataPoints two-dimensional array converted into JSON objects

Testing our app

We should be good to go. Let us test our very basic PHP application. We first need to start our server. This is accomplished by running the following command in a terminal window in the root of our application:

php -S localhost:8888

The above starts the PHP development server and listens on port 8888.

Point your browser to http://localhost:8888. You should see the following:


Click on the first "Create school database and students table in SQLite." link to create the database and Students table. This displays the following output with the INSERT statement.


If you look into the root folder of your app, you will see that a school.db file was created.

Click on the "BACK" link to return to the home page. 

Next click on the "Import seed data from csv file." link to import CSV data into the Students database table. This displays a series of INSERT statements as shown below:


Return to the home page and click on the third "List data" link. You will see that data was imported into the database:


Return to the home page and click on the last "Display chart with Canvas.JS" link to see our pie chart.

I trust that this simple tutorial will help you visualize data with PHP.

Monday, December 20, 2021

Generate charts with Google DataTable .NET Wrapper from ASP.NET 6.0 Razor Pages App

The scenario that this article addresses is a situation whereby there is server-side generated data that needs to be displayed on a web page as a chart. The API used for generating the chart is the freely available Google Charts JavaScript-based API. The Google DataTable .NET Wrapper is used to create a lightweight representation of the google.visualization.DataTable object directly in Microsoft.NET. The wrapper allows for the creation of the appropriate JSON which is easily ingested by the Google Chart Tools JavaScript library.

I will show you how to generate six types of charts to display dynamically generated data. The source of data will be the well known Northwind database running in a Docker container. I will work with the ASP.NET Razor Pages template (AKA Web App).

Source code:  https://github.com/medhatelmasry/ChartRazorGoogleWrapper

The environment I am using is: 

  • Windows 11
  • Docker Desktop for Windows
  • .NET version 6.0.100
  • Visual Studio Code

Start Northwind database in a Docker container

To pull & run the Northwind database in a Docker container, run the following command in a terminal window:

docker run -d --name nw -p 1444:1433 kcornwall/sqlnorthwind

The above command does the following:

Docker image:kcornwall/sqlnorthwind
Container Name (--name):nw
Ports (-p):Port 1433 in container is exposed as port 1444 on the host computer
Password:The sa password is Passw0rd2018. This was determined from the Docker Hub page for the image.
-d:Starts the container in detached mode

This is what I experienced after I ran the above command:


Let us make sure that the container is running. Execute this command to ensure that the container is indeed running.

docker ps

The following confirmed to me that the container is running:

Project setup

Run the following command to create an ASP.NET Core MVC application using .NET 6.0 in a folder named ChartRazorGoogleWrapper:

dotnet new razor -f net6.0 -o ChartRazorGoogleWrapper

Change directory into the new folder and open the project inside VS Code with the following commands:

cd ChartRazorGoogleWrapper 

code .

We will need to install an Entity Framework command-line utility. If you have not done so already, install dotnet-ef with this command:

dotnet tool install –g dotnet-ef 

It does not hurt to upgrade this tool to the latest version with:

dotnet tool update -g dotnet-ef

Also, from within the root folder of your project, add some SQL-Server and Entity Framework related packages with the following terminal-window commands:

dotnet add package Microsoft.EntityFrameworkCore.Design
dotnet add package Microsoft.EntityFrameworkCore.SqlServer
dotnet add package Microsoft.EntityFrameworkCore.Tools


Also, install the Google DataTable .NET Wrapper Nuget package:

dotnet add package Google.DataTable.Net.Wrapper

In appsettings.json, add this to ConnectionStrings block just before “Logging”:

"ConnectionStrings": {
    "NW": "Data Source=localhost,1444;Initial Catalog=Northwind;Persist Security Info=True;User ID=sa;Password=Passw0rd2018"
},

Next, let us reverse engineer only the Orders entities in the Northwind database. Execute this command from the root of your project:

dotnet-ef dbcontext scaffold "Data Source=localhost,1444;Initial Catalog=Northwind;Persist Security Info=True;User ID=sa;Password=Passw0rd2018" Microsoft.EntityFrameworkCore.SqlServer -c NorthwindContext -o NW --table Orders

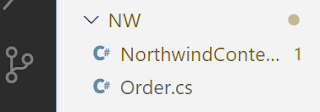
This creates a NW folder in your project with entity Orders and database context class NorthwindContext.


Delete the OnConfiguring() method in NorthwindContext.cs so that there is no hard-coded connection string in our C# code.

Add the following code to Program.cs right after where the variable builder is declared:

var connectionString = builder.Configuration.GetConnectionString("NW");
builder.Services.AddDbContext<NorthwindContext>(options => {
  options.UseSqlServer(connectionString);
});

Reading data

In the Pages folder, add two files ChartData.cshtml and ChartData.cshtml.cs.

Content of ChartData.cshtml is:

@page
@model ChartDataModel

Content of ChartData.cshtml.cs is:

using ChartRazorGoogleWrapper.NW;
using Google.DataTable.Net.Wrapper;
using Microsoft.AspNetCore.Mvc;
using Microsoft.AspNetCore.Mvc.RazorPages;
using Microsoft.EntityFrameworkCore;

namespace ChartRazorGoogleWrapper.Pages;

public class ChartDataModel : PageModel {
   private readonly ILogger<ChartDataModel> _logger;
   private readonly NorthwindContext _northwindContext;

   public ChartDataModel(ILogger<ChartDataModel> logger, NorthwindContext northwindContext) {
     _logger = logger;
     _northwindContext = northwindContext;
   }

   public async Task<IActionResult> OnGet() {
     var data = await _northwindContext.Orders
     .GroupBy(_ => _.ShipCity)
     .Select(g => new {
         Name = g.Key,
         Count = g.Count()
     })
     .OrderByDescending(cp => cp.Count)
     .ToListAsync();

     //let's instantiate the DataTable.
     var dt = new Google.DataTable.Net.Wrapper.DataTable();
     dt.AddColumn(new Column(ColumnType.String, "Name", "Name"));
     dt.AddColumn(new Column(ColumnType.Number, "Count", "Count"));

     foreach (var item in data) {
         Row r = dt.NewRow();
         r.AddCellRange(new Cell[] {
             new Cell(item.Name),
             new Cell(item.Count)
         });
         dt.AddRow(r);
     }

     //Let's create a Json string as expected by the Google Charts API.
     return Content(dt.GetJson());
   }
}

The above code in ChartData.cshtml.cs returns a JSON representation of  Google.DataTable.Net.Wrapper.DataTable. It contains data from the Northwind database representing the number of orders by city.

At this stage, let's run our web application and verify that we are indeed able to read data from the Northwind database and subsequently generate JSON data. Run your application with:

dotnet watch run

Point your browser to https://localhost:7108/chartdata

NOTE: you will need to adjust the port number to suit your environment.

This is what was revealed in my browser:


We have a sense of assurance that our data is ready to be displayed in a chart.

Charting the data

Replace your Pages/Index.cshtml with the following code:

@page
@model IndexModel

<script type="text/javascript" src="https://www.gstatic.com/charts/loader.js"></script>

<div id="column_chart_div"></div>
<div id="line_chart_div"></div>
<div id="pie_chart_div"></div>
<div id="area_chart_div"></div>
<div id="bar_chart_div"></div>
<div id="pie_chart_3d_div"></div>


<script type="text/javascript">
    google.charts.load('current', {
        packages: ['corechart', 'bar']
    });

    google.setOnLoadCallback(drawChart);

    function drawChart() {
        var jsonData = $.ajax({
            url: '/ChartData',
            dataType: "json",
            async: false
        }).responseText;

        PopulationChart(jsonData, "column-chart");
        PopulationChart(jsonData, "line-chart");
        PopulationChart(jsonData, "pie-chart");
        PopulationChart(jsonData, "area-chart");
        PopulationChart(jsonData, "bar-chart");
        PopulationChart(jsonData, "pie-chart-3d");
    }

    function PopulationChart(jsonData, chart_type) {
        // Create our data table out of JSON data loaded from server.
        var data = new google.visualization.DataTable(jsonData);
        var chart;
        var options = { title: 'Orders by city' };

        switch (chart_type) {

            case "line-chart":
                chart = new google.visualization.LineChart(document.getElementById('line_chart_div'));
                break;
            case "pie-chart":
                chart = new google.visualization.PieChart(document.getElementById('pie_chart_div'));
                break;
            case "area-chart":
                chart = new google.visualization.AreaChart(document.getElementById('area_chart_div'));
                break;
            case "bar-chart":
                chart = new google.visualization.BarChart(document.getElementById('bar_chart_div'));
                break;
            case "pie-chart-3d":
                options.is3D = true;
                chart = new google.visualization.PieChart(document.getElementById('pie_chart_3d_div'));
                break;
            default:
                chart = new google.visualization.ColumnChart(document.getElementById('column_chart_div'));
                break;
        }

        chart.draw(data, options);
        return false;
    }

</script>    

If you point your browser to the home page, you should see six charts, namely: column, line, pie, area, bar and pie 3D charts.


Conclusion

This shows you how the Google Chart Tools JavaScript library makes it much easier to generate charts from an ASP.NET Razor application.


Sunday, December 19, 2021

Using Google Charts API with an ASP.NET Core 6.0 Razor Pages App

Google Charts is a free JavaScript API that you can use to generate good looking charts on a web page. Although it has nothing to do with C# and .NET, we can still use it in an ASP.NET application. I will show you how to generate five types of charts to display dynamically generated data. The source of data will be the well known Northwind database running in a Docker container.

In another article, I show how to use Google charts with an ASP.NET Core MVC application.  In this article, I work with the ASP.NET Razor Pages template (AKA Web App), instead.

Source code: https://github.com/medhatelmasry/gChartRazor

The environment I am using is:

  • Windows 11
  • Docker Desktop for Windows
  • .NET version 6.0.100
  • Visual Studio Code

Start Northwind database in a Docker container

To pull & run the Northwind database in a Docker container, run the following command in a terminal window:

docker run -d --name nw -p 1444:1433 kcornwall/sqlnorthwind

The above command does the following:

Docker image:kcornwall/sqlnorthwind
Container Name (--name):nw
Ports (-p):Port 1433 in container is exposed as port 1444 on the host computer
Password:The sa password is Passw0rd2018. This was determined from the Docker Hub page for the image.
-d:Starts the container in detached mode

This is what I experienced after I ran the above command:


Let us make sure that the container is running. Execute this command to ensure that the container is indeed running.

docker ps

The following confirmed to me that the container is running:

Project setup

Run the following command to create an ASP.NET Core razor pages application using .NET 6.0 in a folder named gChartRazor:

dotnet new razor -f net6.0 -o gChartRazor

Change directory into the new folder and open the project inside VS Code with the following commands:

cd gChartRazor 

code .

We will need to install an Entity Framework command-line utility. If you have not done so already, install dotnet-ef with this command:

dotnet tool install –g dotnet-ef 

It does not hurt to upgrade this tool to the latest version with:

dotnet tool update -g dotnet-ef

Also, from within the root folder of your project, add some SQL-Server and Entity Framework related packages with the following terminal-window commands:

dotnet add package Microsoft.EntityFrameworkCore.Design
dotnet add package Microsoft.EntityFrameworkCore.SqlServer
dotnet add package Microsoft.EntityFrameworkCore.Tools

In appsettings.json, add this to ConnectionStrings block just before “Logging”:

"ConnectionStrings": {
    "NW": "Data Source=localhost,1444;Initial Catalog=Northwind;Persist Security Info=True;User ID=sa;Password=Passw0rd2018"
},

Next, let us reverse engineer the Products Categories entities in the Northwind database. Execute this command from the root of your project:

dotnet-ef dbcontext scaffold "Data Source=localhost,1444;Initial Catalog=Northwind;Persist Security Info=True;User ID=sa;Password=Passw0rd2018" Microsoft.EntityFrameworkCore.SqlServer -c NorthwindContext -o NW --table Products --table Categories

This creates a NW folder in your project with entities Category Product. It also adds the database context class NorthwindContext.


Delete the OnConfiguring() method in NorthwindContext.cs so that there is no hard-coded connection string in our C# code.

Add the following code to Program.cs right after where the variable builder is declared:

var connectionString = builder.Configuration.GetConnectionString("NW");
builder.Services.AddDbContext<NorthwindContext>(options => {
  options.UseSqlServer(connectionString);
});

Reading data

In the Pages folder, add two files ChartData.cshtml and ChartData.cshtml.cs.

Content of ChartData.cshtml is:

@page
@model ChartDataModel

Content of ChartData.cshtml.cs is:

using gChartRazor.NW;
using Microsoft.AspNetCore.Mvc;
using Microsoft.AspNetCore.Mvc.RazorPages;
using Microsoft.EntityFrameworkCore;

namespace gChartRazor.Pages;

public class ChartDataModel : PageModel {
   private readonly ILogger<ChartDataModel> _logger;
   private readonly NorthwindContext _northwindContext;

   public ChartDataModel(ILogger<ChartDataModel> logger, NorthwindContext northwindContext) {
     _logger = logger;
     _northwindContext = northwindContext;
   }

   public async Task<JsonResult> OnGet() {
     var query = await _northwindContext.Products
     .Include(c => c.Category)
     .GroupBy(p => p.Category!.CategoryName)
     .Select(g => new
     {
         Name = g.Key,
         Count = g.Count()
     })
     .OrderByDescending(cp => cp.Count)
     .ToListAsync();

     return new JsonResult(query);
   }
}

The above code in ChartData.cshtml.cs returns a JSON array with data from the Northwind database representing the number of products in each category.

At this stage, let's run our web application and verify that we are indeed able to read data from the Northwind database and subsequently generate JSON data. Run your application with:

dotnet watch run

Point your browser to https://localhost:7108/chartdata

NOTE: you will need to adjust the port number to suit your environment.

This is what was revealed in my browser:


We have a sense of assurance that our data is ready to be displayed in a chart.

Charting the data

Replace your Pages/Index.cshtml with the following code:

@page
@model IndexModel
@{
    ViewData["Title"] = "Home page";
}

<title>@ViewData["Title"] - Google Charts</title>  
<script type="text/javascript" src="https://www.gstatic.com/charts/loader.js"></script>  
  
<div id="column_chart_div"></div>  
<div id="line_chart_div"></div>  
<div id="pie_chart_div"></div>  
<div id="area_chart_div"></div>  
<div id="bar_chart_div"></div>  
<script type="text/javascript">  
  
   google.charts.load('current', {  
     packages: ['corechart', 'bar']  
   });  
   google.charts.setOnLoadCallback(LoadData);  
   function LoadData() {  
      $.ajax({  
         url: '/ChartData',  
         dataType: "json",  
         type: "GET",  
         error: function(xhr, status, error) {  
            toastr.error(xhr.responseText);  
         },  
         success: function(data) {  
            PopulationChart(data, "column-chart");  
            PopulationChart(data, "line-chart");  
            PopulationChart(data, "pie-chart");  
            PopulationChart(data, "area-chart"); 
            PopulationChart(data, "bar-chart"); 
            return false;  
         }  
      });  
      return false;  
   }  
   function PopulationChart(data, chart_type) {  
      var dataArray = [  
         ['Category', 'Product']  
      ];  
      $.each(data, function(i, item) {  
         dataArray.push([item.name, item.count]);  
      });  
      var data = google.visualization.arrayToDataTable(dataArray);  
      var options = {  
         title: 'Product count by category',  
         chartArea: {  
             width: '80%'  
         },  
         colors: ['#b0120a', '#7b1fa2', '#ffab91', '#d95f02'],  
         hAxis: {  
             title: 'Categories',  
             minValue: 0  
         },  
         vAxis: {  
             title: 'Product Count'  
         }  
      };  
      var chart;
      switch(chart_type) {
         case "line-chart":
            chart = new google.visualization.LineChart(document.getElementById('line_chart_div'));  
            break;
         case "pie-chart":
            chart = new google.visualization.PieChart(document.getElementById('pie_chart_div'));  
            break;
         case "area-chart":
            chart = new google.visualization.AreaChart(document.getElementById('area_chart_div'));  
            break;
         case "bar-chart":
            chart = new google.visualization.BarChart(document.getElementById('bar_chart_div'));  
            break;
         default:
            chart = new google.visualization.ColumnChart(document.getElementById('column_chart_div'));  
            break;
      }
      chart.draw(data, options);  
      return false;  
   }  
</script>    

If you point your browser to the home page, you should see five charts, namely: column, line, pie, area and bar charts.


Conclusion

I trust the above article helps you consider using Google Charts with ASP.NET Razor Pages to visually display data.


Saturday, December 18, 2021

Using Google Charts API with an ASP.NET Core 6.0 MVC app

Google Charts is a free JavaScript API that you can use to generate good looking charts on a web page. Although it has nothing to do with C# and .NET, we can still use it in an ASP.NET application. In this article, I will show you how to generate five types of charts to display dynamically generated data. The source of data will be the well known Northwind database running in a Docker container.

In another article, I show how to use Google charts with an ASP.NET Core Razor Pages application.  In this article, I work with the ASP.NET MVC template, instead.

Source code: https://github.com/medhatelmasry/gChartMVC

The environment I am using is:

  • Windows 11
  • Docker Desktop for Windows
  • .NET version 6.0.100
  • Visual Studio Code

Start Northwind database in a Docker container

To pull & run the Northwind database in a Docker container, run the following command in a terminal window:

docker run -d --name nw -p 1444:1433 kcornwall/sqlnorthwind

The above command does the following:

Docker image: kcornwall/sqlnorthwind
Container Name (--name): nw
Ports (-p): Port 1433 in container is exposed as port 1444 on the host computer
Password: The sa password is Passw0rd2018. This was determined from the Docker Hub page for the image.
-d: Starts the container in detached mode

This is what I experienced after I ran the above command:


Let us make sure that the container is running. Execute this command to ensure that the container is indeed running.

docker ps

The following confirmed to me that the container is running:

Project setup

Run the following command to create an ASP.NET Core MVC application using .NET 6.0 in a folder named gChartMVC:

dotnet new mvc -f net6.0 -o gChartMVC

Change directory into the new folder and open the project inside VS Code with the following commands:

cd gChartMVC 

code .

We will need to install an Entity Framework command-line utility. If you have not done so already, install dotnet-ef with this command:

dotnet tool install –g dotnet-ef 

It does not hurt to upgrade this tool to the latest version with:

dotnet tool update -g dotnet-ef

Also, from within the root folder of your project, add some SQL-Server and Entity Framework related packages with the following terminal-window commands:

dotnet add package Microsoft.EntityFrameworkCore.Design
dotnet add package Microsoft.EntityFrameworkCore.SqlServer
dotnet add package Microsoft.EntityFrameworkCore.Tools

In appsettings.json, add this to ConnectionStrings block just before “Logging”:

"ConnectionStrings": {
    "NW": "Data Source=localhost,1444;Initial Catalog=Northwind;Persist Security Info=True;User ID=sa;Password=Passw0rd2018"
},

Next, let us reverse engineer the Products & Categories entities in the Northwind database. Execute this command from the root of your project:

dotnet-ef dbcontext scaffold "Data Source=localhost,1444;Initial Catalog=Northwind;Persist Security Info=True;User ID=sa;Password=Passw0rd2018" Microsoft.EntityFrameworkCore.SqlServer -c NorthwindContext -o NW --table Products --table Categories

This creates a NW folder in your project with entities Category & Product. It also adds the database context class NorthwindContext.


Delete the OnConfiguring() method in NorthwindContext.cs so that there is no hard-coded connection string in our C# code.

Add the following code to Program.cs right after where the variable builder is declared:

var connectionString = builder.Configuration.GetConnectionString("NW");
builder.Services.AddDbContext<NorthwindContext>(options => {
  options.UseSqlServer(connectionString);
});

Reading data

Let's take advantage of dependency injection to access the database through an instance of the NorthwindContext. Add the following instance variable declaration to the top of the HomeController class:

private readonly NorthwindContext _northwindContext;

Update the HomeController constructor so it looks like this:

public HomeController(ILogger<HomeController> logger, NorthwindContext northwindContext) {
  _logger = logger;
  _northwindContext = northwindContext;
}

We will next add a method to the HomeController that can be called from our JavaScript front-end that reads products by category. 

public async Task<JsonResult> ChartData() {
   var query = await _northwindContext.Products
     .Include(c => c.Category)
     .GroupBy(p => p.Category!.CategoryName)
     .Select(g => new
     {
         Name = g.Key,
         Count = g.Count()
     })
     .OrderByDescending(cp => cp.Count)
        .ToListAsync();

   return Json(query);
}

At this stage, let's run our web application and verify that we are indeed able to read data from the Northwind database and subsequently generate JSON data. Run your application with:

dotnet watch run

Point your browser to https://localhost:7108/home/chartdata

NOTE: you will need to adjust the port number to suit your environment.

This is what was revealed in my browser:


We have a sense of assurance that our data is ready to be displayed in a chart.

Charting the data

Replace your Views/Home/Index.cshtml with the following code:

<title>@ViewData["Title"] - Google Charts</title>  
<script type="text/javascript" src="https://www.gstatic.com/charts/loader.js"></script>  
  
<div id="column_chart_div"></div>  
<div id="line_chart_div"></div>  
<div id="pie_chart_div"></div>  
<div id="area_chart_div"></div>  
<div id="bar_chart_div"></div>  
<script type="text/javascript">  
  
   google.charts.load('current', {  
     packages: ['corechart', 'bar']  
   });  
   google.charts.setOnLoadCallback(LoadData);  
   function LoadData() {  
      $.ajax({  
         url: '/Home/ChartData',  
         dataType: "json",  
         type: "GET",  
         error: function(xhr, status, error) {  
            toastr.error(xhr.responseText);  
         },  
         success: function(data) {  
            PopulationChart(data, "column-chart");  
            PopulationChart(data, "line-chart");  
            PopulationChart(data, "pie-chart");  
            PopulationChart(data, "area-chart"); 
            PopulationChart(data, "bar-chart"); 
            return false;  
         }  
      });  
      return false;  
   }  
   function PopulationChart(data, chart_type) {  
      var dataArray = [  
         ['Category', 'Product']  
      ];  
      $.each(data, function(i, item) {  
         dataArray.push([item.name, item.count]);  
      });  
      var data = google.visualization.arrayToDataTable(dataArray);  
      var options = {  
         title: 'Product count by category',  
         chartArea: {  
             width: '80%'  
         },  
         colors: ['#b0120a', '#7b1fa2', '#ffab91', '#d95f02'],  
         hAxis: {  
             title: 'Categories',  
             minValue: 0  
         },  
         vAxis: {  
             title: 'Product Count'  
         }  
      };  
      var chart;
      switch(chart_type) {
         case "line-chart":
            chart = new google.visualization.LineChart(document.getElementById('line_chart_div'));  
            break;
         case "pie-chart":
            chart = new google.visualization.PieChart(document.getElementById('pie_chart_div'));  
            break;
         case "area-chart":
            chart = new google.visualization.AreaChart(document.getElementById('area_chart_div'));  
            break;
         case "bar-chart":
            chart = new google.visualization.BarChart(document.getElementById('bar_chart_div'));  
            break;
         default:
            chart = new google.visualization.ColumnChart(document.getElementById('column_chart_div'));  
            break;
      }
      chart.draw(data, options);  
      return false;  
   }  
</script>  

If you point your browser to the home page, you should see five charts, namely: column, line, pie, area and bar charts.


Conclusion

I trust the above article helps you consider using Google Charts with ASP.NET MVC apps to visually display data.