Wednesday, December 29, 2021

Generate PDF reports from API data using iText 7 Core library in ASP.NET Razor Pages 6.0

 PDF stands for "Portable Document Format". It is, indeed, the standard for exchanging formatted documents on the internet. PDF documents are read by Adobe Acrobat Reader, most browsers, and even some popular word processors like Microsoft Word. It is a common used-case to generate PDF reports from live data. In this tutorial, I shall show you how you can easily generate a PDF report in an ASP.NET Core Razor Pages app and display data that originates from a Products API. We shall use the iText 7 library to accomplish this task. 

Source Code: https://github.com/medhatelmasry/RazorPdfDemo
Companion Video: https://youtu.be/5KxxRbApoRY

The environment I am using is:

  • Windows 11
  • .NET version 6.0.100
  • Visual Studio Code

The products API

We will work with the products API at https://northwind.vercel.app/api/products. The data in the API is generated from the well known Northwind sample SQL Server database. If you point your browser to the above address, you will see the following:

Project setup

Run the following command to create an ASP.NET Core Razor Pages application using .NET 6.0 in a folder named RazorPdfDemo:

dotnet new razor -f net6.0 -o RazorPdfDemo

Change directory into the new folder and open the project inside VS Code with the following commands:

cd RazorPdfDemo

code .

Add the iText 7 Core package so that we have the ability to generate PDF output.

dotnet add package itext7 --version 7.2.0

Product model class

Each Product JSON object contains the following properties:

Id (int)
SupplierId (int)
CategoryId (int)
QuantityPerUnit (string)
UnitPrice (decimal)
UnitsInStock (short)
ReorderLevel (short)
Discontinued (bool)
Name (string)

We need to create a Product model class that represents the above JSON object. Therefore create a Models folder and add to it a Product class with the following content:

public partial class Product {
  [JsonPropertyName("id")]
  public int Id { get; set; } 
  [JsonPropertyName("supplierId")]
  public int? SupplierId { get; set; }
  [JsonPropertyName("categoryId")]
  public int? CategoryId { get; set; }
  [JsonPropertyName("quantityPerUnit")]
  public string? QuantityPerUnit { get; set; }
  [JsonPropertyName("unitPrice")]
  public decimal? UnitPrice { get; set; }
  [JsonPropertyName("unitsInStock")]
  public short? UnitsInStock { get; set; }
  [JsonPropertyName("unitsOnOrder")]
  public short? UnitsOnOrder { get; set; }
  [JsonPropertyName("reorderLevel")]
  public short? ReorderLevel { get; set; }
  [JsonPropertyName("discontinued")]
  public bool Discontinued { get; set; }
  [JsonPropertyName("name")]
  public string Name { get; set; } = null!;
}

Generating PDF report

In the Pages folder, create two new files named Report.cshtml and Report.cshtml.cs

Add the following C# code to Report.cshtml.cs:

using iText.Kernel.Colors;
using iText.Kernel.Geom;
using iText.Kernel.Pdf;
using iText.Kernel.Pdf.Canvas.Draw;
using iText.Layout;
using iText.Layout.Element;
using iText.Layout.Properties;
using Microsoft.AspNetCore.Mvc;
using Microsoft.AspNetCore.Mvc.RazorPages;
using RazorPdfDemo.Models;
using System.Text.Json;

namespace RazorPdfDemo.Pages;

public class ReportModel : PageModel {
  private readonly ILogger<IndexModel> _logger;

  public ReportModel(ILogger<IndexModel> logger) {
    _logger = logger;
  }

  public async Task<IActionResult> OnGet() {
    MemoryStream ms = new MemoryStream();

    PdfWriter writer = new PdfWriter(ms);
    PdfDocument pdfDoc = new PdfDocument(writer);
    Document document = new Document(pdfDoc, PageSize.A4, false);
    writer.SetCloseStream(false);

    Paragraph header = new Paragraph("Northwind Products")
      .SetTextAlignment(TextAlignment.CENTER)
      .SetFontSize(20);

    document.Add(header);

    Paragraph subheader = new Paragraph(DateTime.Now.ToShortDateString())
      .SetTextAlignment(TextAlignment.CENTER)
      .SetFontSize(15);
    document.Add(subheader);

    // empty line
    document.Add(new Paragraph(""));

    // Line separator
    LineSeparator ls = new LineSeparator(new SolidLine());
    document.Add(ls);

    // empty line
    document.Add(new Paragraph(""));

    // Add table containing data
    document.Add(await GetPdfTable());

    // Page Numbers
    int n = pdfDoc.GetNumberOfPages();
    for (int i = 1; i <= n; i++) {
      document.ShowTextAligned(new Paragraph(String
        .Format("Page " + i + " of " + n)),
        559, 806, i, TextAlignment.RIGHT,
        VerticalAlignment.TOP, 0);
    }

    document.Close();
    byte[] byteInfo = ms.ToArray();
    ms.Write(byteInfo, 0, byteInfo.Length);
    ms.Position = 0;

    FileStreamResult fileStreamResult = new FileStreamResult(ms, "application/pdf");

    //Uncomment this to return the file as a download
    //fileStreamResult.FileDownloadName = "NorthwindProducts.pdf";

    return fileStreamResult;
  }

  private async Task<Table> GetPdfTable() {
      // Table
      Table table = new Table(4, false);

      // Headings
      Cell cellProductId = new Cell(1, 1)
         .SetBackgroundColor(ColorConstants.LIGHT_GRAY)
         .SetTextAlignment(TextAlignment.CENTER)
         .Add(new Paragraph("Product ID"));

      Cell cellProductName = new Cell(1, 1)
         .SetBackgroundColor(ColorConstants.LIGHT_GRAY)
         .SetTextAlignment(TextAlignment.LEFT)
         .Add(new Paragraph("Product Name"));

      Cell cellQuantity = new Cell(1, 1)
         .SetBackgroundColor(ColorConstants.LIGHT_GRAY)
         .SetTextAlignment(TextAlignment.CENTER)
         .Add(new Paragraph("Quantity"));

      Cell cellUnitPrice = new Cell(1, 1)
         .SetBackgroundColor(ColorConstants.LIGHT_GRAY)
         .SetTextAlignment(TextAlignment.CENTER)
         .Add(new Paragraph("Unit Price"));

      table.AddCell(cellProductId);
      table.AddCell(cellProductName);
      table.AddCell(cellQuantity);
      table.AddCell(cellUnitPrice);

      Product[] products = await GetProductsAsync();

      foreach (var item in products) {
        Cell cId = new Cell(1, 1)
            .SetTextAlignment(TextAlignment.CENTER)
            .Add(new Paragraph(item.Id.ToString()));

        Cell cName = new Cell(1, 1)
            .SetTextAlignment(TextAlignment.LEFT)
            .Add(new Paragraph(item.Name));

        Cell cQty = new Cell(1, 1)
            .SetTextAlignment(TextAlignment.RIGHT)
            .Add(new Paragraph(item.UnitsInStock.ToString()));

        Cell cPrice = new Cell(1, 1)
            .SetTextAlignment(TextAlignment.RIGHT)
            .Add(new Paragraph(String.Format("{0:C2}", item.UnitPrice)));

        table.AddCell(cId);
        table.AddCell(cName);
        table.AddCell(cQty);
        table.AddCell(cPrice);
      }

      return table;
  }

  private async Task<Product[]> GetProductsAsync() {
    HttpClient client = new HttpClient();
    var stream = client.GetStreamAsync("https://northwind.vercel.app/api/products");
    var products = await JsonSerializer.DeserializeAsync<Product[]>(await stream);
    
    return products!;
  }
}

What does the above code do?
  1. The GetProductsAsync() method makes an HTTP GET request to endpoint https://northwind.vercel.app/api/products and reads products data. It then de-serializes the data into an array of Product objects and subsequently returns the array.
  2. The GetPdfTable() method does the following:
    • The heading of the table is created. There will be four columns with titles: Product IDProduct NameQuantity and Unit Price
    • An array of Product objects is obtained from a call to the GetProductsAsync() method
    • We iterate through each item in the array and add rows of data to the table
  3. The OnGet() method does the following:
    • The first five lines in the OnGet() method sets up all the objects that are needed to generate a PDF document.
    • A header with title "Northwind Products" is placed at the top of the report - center aligned.
    • A sub-header with the current date is placed under the heading - also center aligned.
    • This is followed by an empty line, a solid-line, and another empty line.
    • The table containing product data is then displayed.
    • Paging is added to the top right-side of each page
    • Finally, the report is streamed down to the browser.
Add the following code to Report.cshtml:

@page
@model ReportModel

Let us add a menu item to the navigation of our web app. Open Pages/Shared/_Layout.cshtml and add the following markup code to the bottom of the <ul> .... </ul> navigation block:

<li class="nav-item">
  <a class="nav-link text-dark" asp-area="" asp-page="/Report">Products PDF</a>
</li>

At this stage, let's run our web app and verify that we are indeed able to read data from the Northwind products API and subsequently generate a PDF report. Run your application with:

dotnet watch run

Point your browser to https://localhost:7292

NOTE: you will need to adjust the port number to suit your environment.

This is what the home page looks like:


Click on "Products PDF". You should soon after see the PDF document being generated in your browser:


You can click on the download icon on the top right-side of the report in order to download a copy of the report. 

Alternatively, you can uncomment the following code in the OnGet() method if you want the report to get directly downloaded to your computer:

// fileStreamResult.FileDownloadName = "NorthwindProducts.pdf";

When you run the app again and click on the "Products PDF" link, the report named "NorthwindProducts.pdf" gets immediately downloaded to your computer.

Conclusion

Using the iText 7 library is pretty straight forward when it comes to generating PDF documents. You can learn more at https://kb.itextpdf.com/home/it7kb/ebooks/itext-7-jump-start-tutorial-for-net.

This article is intended to provide you with a good starting point for generating PDF reports from your ASP.NET Razor Pages web apps.

Tuesday, December 28, 2021

Generate PDF reports from SQL Server data using iText 7 Core library in ASP.NET Core MVC 6.0

PDF stands for "Portable Document Format". It is, indeed, the standard for exchanging formatted documents on the internet. PDF documents are read by Adobe Acrobat Reader, most browsers, and even some popular word processors like Microsoft Word. It is a common used-case to generate PDF documents from live data. In this tutorial, I shall show you how you can easily generate a PDF report in an ASP.NET Core MVC app and display data that originates from the sample SQL Server database named Northwind. We shall use the iText 7 library to accomplish this task. 

Source Code: https://github.com/medhatelmasry/MvcPdfDemo

The environment I am using is:

  • Windows 11
  • Docker Desktop for Windows
  • .NET version 6.0.100
  • Visual Studio Code

Start Northwind database in a Docker container

To pull & run the Northwind database in a Docker container, run the following command in a terminal window:

docker run -d --name nw -p 1444:1433 kcornwall/sqlnorthwind

The above command does the following:

Docker image:kcornwall/sqlnorthwind
Container Name (--name):nw
Ports (-p):Port 1433 in container is exposed as port 1444 on the host computer
Password:The sa password is Passw0rd2018. This was determined from the Docker Hub page for the image.
-d:Starts the container in detached mode

This is what I experienced after I ran the above command:


Let us make sure that the container is running. Execute this command to ensure that the container is indeed running.

docker ps

The following confirmed to me that the container is running:

Project setup

Run the following command to create an ASP.NET Core MVC application using .NET 6.0 in a folder named MvcPdfDemo:

dotnet new mvc -f net6.0 -o MvcPdfDemo

Change directory into the new folder and open the project inside VS Code with the following commands:

cd MvcPdfDemo

code .

We will need to install an Entity Framework command-line utility. If you have not done so already, install dotnet-ef with this command:

dotnet tool install -g dotnet-ef 

It does not hurt to upgrade this tool to the latest version with:

dotnet tool update -g dotnet-ef

Also, from within the root folder of your project, add some SQL-Server and Entity Framework related packages with the following terminal-window commands:

dotnet add package Microsoft.EntityFrameworkCore.Design
dotnet add package Microsoft.EntityFrameworkCore.SqlServer
dotnet add package Microsoft.EntityFrameworkCore.Tools

Also, add the iText 7 Core package so that we have the ability to generate PDF output.

dotnet add package itext7 --version 7.2.0

In appsettings.json, add this to ConnectionStrings block just before “Logging”:

"ConnectionStrings": {
    "NW": "Data Source=localhost,1444;Initial Catalog=Northwind;Persist Security Info=True;User ID=sa;Password=Passw0rd2018"
},

Next, let us reverse engineer the Products entity in the Northwind database. Execute this command from the root of your project:

dotnet-ef dbcontext scaffold "Data Source=localhost,1444;Initial Catalog=Northwind;Persist Security Info=True;User ID=sa;Password=Passw0rd2018" Microsoft.EntityFrameworkCore.SqlServer -c NorthwindContext -o Models/NW --table Products

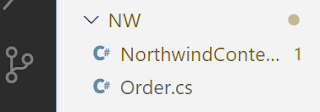
This creates a Models/NW folder in your project with entity Product. It also adds the database context class NorthwindContext.


Delete the OnConfiguring() method in NorthwindContext.cs so that there is no hard-coded connection string in our C# code.

Add the following code to Program.cs right after where the variable builder is declared around line 2:

var connectionString = builder.Configuration.GetConnectionString("NW");
builder.Services.AddDbContext<NorthwindContext>(options => {
  options.UseSqlServer(connectionString);
});

Generating PDF report


Let's take advantage of dependency injection to access the database through an instance of the NorthwindContext. Add the following instance variable declaration to the top of the HomeController class:

private readonly NorthwindContext _northwindContext;

Update the HomeController constructor so it looks like this:

public HomeController(
  ILogger<HomeController> logger, 
  NorthwindContext northwindContext) {
  _logger = logger;
  _northwindContext = northwindContext;
}

We will next add an action method to the HomeController that will generate and download a PDF report. Add the following helper method that returns a table:

private Table GetPdfTable() {
    // Table
    Table table = new Table(4, false);

    // Headings
    Cell cellProductId = new Cell(1, 1)
       .SetBackgroundColor(ColorConstants.LIGHT_GRAY)
       .SetTextAlignment(TextAlignment.CENTER)
       .Add(new Paragraph("Product ID"));

    Cell cellProductName = new Cell(1, 1)
       .SetBackgroundColor(ColorConstants.LIGHT_GRAY)
       .SetTextAlignment(TextAlignment.LEFT)
       .Add(new Paragraph("Product Name"));

    Cell cellQuantity = new Cell(1, 1)
       .SetBackgroundColor(ColorConstants.LIGHT_GRAY)
       .SetTextAlignment(TextAlignment.CENTER)
       .Add(new Paragraph("Quantity"));

    Cell cellUnitPrice = new Cell(1, 1)
       .SetBackgroundColor(ColorConstants.LIGHT_GRAY)
       .SetTextAlignment(TextAlignment.CENTER)
       .Add(new Paragraph("Unit Price"));

    table.AddCell(cellProductId);
    table.AddCell(cellProductName);
    table.AddCell(cellQuantity);
    table.AddCell(cellUnitPrice);

    var qry = _northwindContext.Products
        .Select(_ => new {
            _.ProductId,
            _.ProductName,
            _.UnitPrice,
            _.UnitsInStock
        });

    foreach (var item in qry) {
        Cell cId = new Cell(1, 1)
            .SetTextAlignment(TextAlignment.CENTER)
            .Add(new Paragraph(item.ProductId.ToString()));

        Cell cName = new Cell(1, 1)
            .SetTextAlignment(TextAlignment.LEFT)
            .Add(new Paragraph(item.ProductName));

        Cell cQty = new Cell(1, 1)
            .SetTextAlignment(TextAlignment.RIGHT)
            .Add(new Paragraph(item.UnitsInStock.ToString()));

        Cell cPrice = new Cell(1, 1)
            .SetTextAlignment(TextAlignment.RIGHT)
            .Add(new Paragraph(String.Format("{0:C2}", item.UnitPrice)));

        table.AddCell(cId);
        table.AddCell(cName);
        table.AddCell(cQty);
        table.AddCell(cPrice);
    }

    return table;
}
 
What does the above code do?
  1. The heading of the table is created. There will be four columns with titles: Product ID, Product Name, Quantity and Unit Price
  2. Using Entity Framework, we make a query that reads all the products from the Northwind database.
  3. We iterate through each item in the query and add rows of data to the table

Our next task is to add an Action method that uses the above GetPdfTable() helper method and returns a PDF document. Add the following Report() action method:

public IActionResult Report() {
  MemoryStream ms = new MemoryStream();

  PdfWriter writer = new PdfWriter(ms);
  PdfDocument pdfDoc = new PdfDocument(writer);
  Document document = new Document(pdfDoc, PageSize.A4, false);
  writer.SetCloseStream(false);

  Paragraph header = new Paragraph("Northwind Products")
    .SetTextAlignment(TextAlignment.CENTER)
    .SetFontSize(20);

  document.Add(header);

  Paragraph subheader = new Paragraph(DateTime.Now.ToShortDateString())
    .SetTextAlignment(TextAlignment.CENTER)
    .SetFontSize(15);
  document.Add(subheader);

  // empty line
  document.Add(new Paragraph(""));

  // Line separator
  LineSeparator ls = new LineSeparator(new SolidLine());
  document.Add(ls);

  // empty line
  document.Add(new Paragraph(""));

  // Add table containing data
  document.Add(GetPdfTable());

  // Page Numbers
  int n = pdfDoc.GetNumberOfPages();
  for (int i = 1; i <= n; i++) {
    document.ShowTextAligned(new Paragraph(String
      .Format("Page " + i + " of " + n)),
      559, 806, i, TextAlignment.RIGHT,
      VerticalAlignment.TOP, 0);
  }

  document.Close();
  byte[] byteInfo = ms.ToArray();
  ms.Write(byteInfo, 0, byteInfo.Length);
  ms.Position = 0;

  FileStreamResult fileStreamResult = new FileStreamResult(ms, "application/pdf");

  //Uncomment this to return the file as a download
  //fileStreamResult.FileDownloadName = "NorthwindProducts.pdf";

  return fileStreamResult;
}

What does the above code do?

  1. The first five lines in the Report() action method sets up all the objects that are needed to generate a PDF document.
  2. A header with title "Northwind Products" is placed at the top of the report - center aligned.
  3. A sub-header with the current date is placed under the heading - also center aligned.
  4. This is followed by an empty line, a solid-line, and another empty line.
  5. The table containing product data is then displayed.
  6. Paging is added to the top right-side of each page
  7. Finally, the report is streamed down to the browser.

Let us add a menu item to the navigation of our web app. Open Views/Shared/_Layout.cshtml and add the following markup code to the bottom of the <ul> .... </ul> navigation block:

<li class="nav-item">
  <a class="nav-link text-dark" asp-area="" asp-controller="Home" asp-action="Report">Products PDF</a>
</li>

At this stage, let's run our web app and verify that we are indeed able to read data from the Northwind database and subsequently generate a PDF report. Run your application with:

dotnet watch run

Point your browser to https://localhost:7052

NOTE: you will need to adjust the port number to suit your environment.

This is what the home page looks like:


Click on "Products PDF". You should soon after see the PDF document being generated in your browser:


You can click on the download icon on the top right-side of the report in order to download a copy of the report. 

Alternatively, you can uncomment the following code if you want the report to get directly downloaded to your computer:

// fileStreamResult.FileDownloadName = "NorthwindProducts.pdf";

If you run the app again and click on the "Products PDF" link, the report named "NorthwindProducts.pdf" gets immediately downloaded to your computer.

Conclusion

I found the iText 7 library pretty straight forward when it comes to generating PDF documents. You can learn more at https://kb.itextpdf.com/home/it7kb/ebooks/itext-7-jump-start-tutorial-for-net.

I hope this provides you with a respectable starting point for generating PDF reports from your ASP.NET MVC web apps.


Monday, December 20, 2021

Deploy multi-container app to Azure App Service with docker-compose

In this article, I will show how easy it is to deploy a multi-container application to Azure App Service using a docker-compose.yml file. This service is currently in preview on Azure. The example is deployment of a WordPress site on the Azure portal. This involves two containers on docker hub, namely: mysql:8.0.0 and wordpress:5.8.2-php7.4-apache.

The only pre-requisite is that you have a valid Azure subscription.

Save the following to a text file named docker-compose.yml:

version: '3.1'

services:

  wordpress:
    image: wordpress:5.8.2-php7.4-apache
    restart: always
    ports:
      - 8888:80
    environment:
      WORDPRESS_DB_HOST: db
      WORDPRESS_DB_USER: exampleuser
      WORDPRESS_DB_PASSWORD: examplepass
      WORDPRESS_DB_NAME: exampledb
    volumes:
      - wordpress:/var/www/html

  db:
    image: mysql:8.0.0
    restart: always
    environment:
      MYSQL_DATABASE: exampledb
      MYSQL_USER: exampleuser
      MYSQL_PASSWORD: examplepass
      MYSQL_RANDOM_ROOT_PASSWORD: '1'
    volumes:
      - db:/var/lib/mysql

volumes:
  wordpress:
  db:

Login to https://portal.azure.com. Create a new app service as follows:
  1. Create a new resource group
  2. Provide a unique host name for your app's URL
  3. Select 'Docker Container" for Publish
  4. Select Linux for the Operating System
  5. Choose a data center closest to your city


Click on the "Next Docker" button.
  1. Select 'Docker Compose (Preview)' for Options.
  2. Select 'Docker Hub' for Image Source
  3. Select Public for Access Type
  4. Beside 'Configuration File', navigate to the docker-compose.yml and select it.

Click on blue "Review + create" button.


Click on the blue Create button. It may take some time to provision the containers. Upon completion, you will see a page that looks like this:


Click on the blue "Go to resource" button.


Click on the URL to view the WordPress page.


Troubleshooting

If something goes wrong and you wish to look into the console logs:

1) Enter 'log' into the filter
2) Turn "App Service Logs" ON


3) Click Save at the top
4) Click on "Log stream"


Cleanup

If you do not need these containers anymore, all you have to do to tear down everything is to delete the resource group.

Conclusion

It is painless to create a multi-container web application using docker-compose.yml.


Generate charts with Google DataTable .NET Wrapper from ASP.NET 6.0 Razor Pages App

The scenario that this article addresses is a situation whereby there is server-side generated data that needs to be displayed on a web page as a chart. The API used for generating the chart is the freely available Google Charts JavaScript-based API. The Google DataTable .NET Wrapper is used to create a lightweight representation of the google.visualization.DataTable object directly in Microsoft.NET. The wrapper allows for the creation of the appropriate JSON which is easily ingested by the Google Chart Tools JavaScript library.

I will show you how to generate six types of charts to display dynamically generated data. The source of data will be the well known Northwind database running in a Docker container. I will work with the ASP.NET Razor Pages template (AKA Web App).

Source code:  https://github.com/medhatelmasry/ChartRazorGoogleWrapper

The environment I am using is: 

  • Windows 11
  • Docker Desktop for Windows
  • .NET version 6.0.100
  • Visual Studio Code

Start Northwind database in a Docker container

To pull & run the Northwind database in a Docker container, run the following command in a terminal window:

docker run -d --name nw -p 1444:1433 kcornwall/sqlnorthwind

The above command does the following:

Docker image:kcornwall/sqlnorthwind
Container Name (--name):nw
Ports (-p):Port 1433 in container is exposed as port 1444 on the host computer
Password:The sa password is Passw0rd2018. This was determined from the Docker Hub page for the image.
-d:Starts the container in detached mode

This is what I experienced after I ran the above command:


Let us make sure that the container is running. Execute this command to ensure that the container is indeed running.

docker ps

The following confirmed to me that the container is running:

Project setup

Run the following command to create an ASP.NET Core MVC application using .NET 6.0 in a folder named ChartRazorGoogleWrapper:

dotnet new razor -f net6.0 -o ChartRazorGoogleWrapper

Change directory into the new folder and open the project inside VS Code with the following commands:

cd ChartRazorGoogleWrapper 

code .

We will need to install an Entity Framework command-line utility. If you have not done so already, install dotnet-ef with this command:

dotnet tool install –g dotnet-ef 

It does not hurt to upgrade this tool to the latest version with:

dotnet tool update -g dotnet-ef

Also, from within the root folder of your project, add some SQL-Server and Entity Framework related packages with the following terminal-window commands:

dotnet add package Microsoft.EntityFrameworkCore.Design
dotnet add package Microsoft.EntityFrameworkCore.SqlServer
dotnet add package Microsoft.EntityFrameworkCore.Tools


Also, install the Google DataTable .NET Wrapper Nuget package:

dotnet add package Google.DataTable.Net.Wrapper

In appsettings.json, add this to ConnectionStrings block just before “Logging”:

"ConnectionStrings": {
    "NW": "Data Source=localhost,1444;Initial Catalog=Northwind;Persist Security Info=True;User ID=sa;Password=Passw0rd2018"
},

Next, let us reverse engineer only the Orders entities in the Northwind database. Execute this command from the root of your project:

dotnet-ef dbcontext scaffold "Data Source=localhost,1444;Initial Catalog=Northwind;Persist Security Info=True;User ID=sa;Password=Passw0rd2018" Microsoft.EntityFrameworkCore.SqlServer -c NorthwindContext -o NW --table Orders

This creates a NW folder in your project with entity Orders and database context class NorthwindContext.


Delete the OnConfiguring() method in NorthwindContext.cs so that there is no hard-coded connection string in our C# code.

Add the following code to Program.cs right after where the variable builder is declared:

var connectionString = builder.Configuration.GetConnectionString("NW");
builder.Services.AddDbContext<NorthwindContext>(options => {
  options.UseSqlServer(connectionString);
});

Reading data

In the Pages folder, add two files ChartData.cshtml and ChartData.cshtml.cs.

Content of ChartData.cshtml is:

@page
@model ChartDataModel

Content of ChartData.cshtml.cs is:

using ChartRazorGoogleWrapper.NW;
using Google.DataTable.Net.Wrapper;
using Microsoft.AspNetCore.Mvc;
using Microsoft.AspNetCore.Mvc.RazorPages;
using Microsoft.EntityFrameworkCore;

namespace ChartRazorGoogleWrapper.Pages;

public class ChartDataModel : PageModel {
   private readonly ILogger<ChartDataModel> _logger;
   private readonly NorthwindContext _northwindContext;

   public ChartDataModel(ILogger<ChartDataModel> logger, NorthwindContext northwindContext) {
     _logger = logger;
     _northwindContext = northwindContext;
   }

   public async Task<IActionResult> OnGet() {
     var data = await _northwindContext.Orders
     .GroupBy(_ => _.ShipCity)
     .Select(g => new {
         Name = g.Key,
         Count = g.Count()
     })
     .OrderByDescending(cp => cp.Count)
     .ToListAsync();

     //let's instantiate the DataTable.
     var dt = new Google.DataTable.Net.Wrapper.DataTable();
     dt.AddColumn(new Column(ColumnType.String, "Name", "Name"));
     dt.AddColumn(new Column(ColumnType.Number, "Count", "Count"));

     foreach (var item in data) {
         Row r = dt.NewRow();
         r.AddCellRange(new Cell[] {
             new Cell(item.Name),
             new Cell(item.Count)
         });
         dt.AddRow(r);
     }

     //Let's create a Json string as expected by the Google Charts API.
     return Content(dt.GetJson());
   }
}

The above code in ChartData.cshtml.cs returns a JSON representation of  Google.DataTable.Net.Wrapper.DataTable. It contains data from the Northwind database representing the number of orders by city.

At this stage, let's run our web application and verify that we are indeed able to read data from the Northwind database and subsequently generate JSON data. Run your application with:

dotnet watch run

Point your browser to https://localhost:7108/chartdata

NOTE: you will need to adjust the port number to suit your environment.

This is what was revealed in my browser:


We have a sense of assurance that our data is ready to be displayed in a chart.

Charting the data

Replace your Pages/Index.cshtml with the following code:

@page
@model IndexModel

<script type="text/javascript" src="https://www.gstatic.com/charts/loader.js"></script>

<div id="column_chart_div"></div>
<div id="line_chart_div"></div>
<div id="pie_chart_div"></div>
<div id="area_chart_div"></div>
<div id="bar_chart_div"></div>
<div id="pie_chart_3d_div"></div>


<script type="text/javascript">
    google.charts.load('current', {
        packages: ['corechart', 'bar']
    });

    google.setOnLoadCallback(drawChart);

    function drawChart() {
        var jsonData = $.ajax({
            url: '/ChartData',
            dataType: "json",
            async: false
        }).responseText;

        PopulationChart(jsonData, "column-chart");
        PopulationChart(jsonData, "line-chart");
        PopulationChart(jsonData, "pie-chart");
        PopulationChart(jsonData, "area-chart");
        PopulationChart(jsonData, "bar-chart");
        PopulationChart(jsonData, "pie-chart-3d");
    }

    function PopulationChart(jsonData, chart_type) {
        // Create our data table out of JSON data loaded from server.
        var data = new google.visualization.DataTable(jsonData);
        var chart;
        var options = { title: 'Orders by city' };

        switch (chart_type) {

            case "line-chart":
                chart = new google.visualization.LineChart(document.getElementById('line_chart_div'));
                break;
            case "pie-chart":
                chart = new google.visualization.PieChart(document.getElementById('pie_chart_div'));
                break;
            case "area-chart":
                chart = new google.visualization.AreaChart(document.getElementById('area_chart_div'));
                break;
            case "bar-chart":
                chart = new google.visualization.BarChart(document.getElementById('bar_chart_div'));
                break;
            case "pie-chart-3d":
                options.is3D = true;
                chart = new google.visualization.PieChart(document.getElementById('pie_chart_3d_div'));
                break;
            default:
                chart = new google.visualization.ColumnChart(document.getElementById('column_chart_div'));
                break;
        }

        chart.draw(data, options);
        return false;
    }

</script>    

If you point your browser to the home page, you should see six charts, namely: column, line, pie, area, bar and pie 3D charts.


Conclusion

This shows you how the Google Chart Tools JavaScript library makes it much easier to generate charts from an ASP.NET Razor application.


Sunday, December 19, 2021

Using Google Charts API with an ASP.NET Core 6.0 Razor Pages App

Google Charts is a free JavaScript API that you can use to generate good looking charts on a web page. Although it has nothing to do with C# and .NET, we can still use it in an ASP.NET application. I will show you how to generate five types of charts to display dynamically generated data. The source of data will be the well known Northwind database running in a Docker container.

In another article, I show how to use Google charts with an ASP.NET Core MVC application.  In this article, I work with the ASP.NET Razor Pages template (AKA Web App), instead.

Source code: https://github.com/medhatelmasry/gChartRazor

The environment I am using is:

  • Windows 11
  • Docker Desktop for Windows
  • .NET version 6.0.100
  • Visual Studio Code

Start Northwind database in a Docker container

To pull & run the Northwind database in a Docker container, run the following command in a terminal window:

docker run -d --name nw -p 1444:1433 kcornwall/sqlnorthwind

The above command does the following:

Docker image:kcornwall/sqlnorthwind
Container Name (--name):nw
Ports (-p):Port 1433 in container is exposed as port 1444 on the host computer
Password:The sa password is Passw0rd2018. This was determined from the Docker Hub page for the image.
-d:Starts the container in detached mode

This is what I experienced after I ran the above command:


Let us make sure that the container is running. Execute this command to ensure that the container is indeed running.

docker ps

The following confirmed to me that the container is running:

Project setup

Run the following command to create an ASP.NET Core razor pages application using .NET 6.0 in a folder named gChartRazor:

dotnet new razor -f net6.0 -o gChartRazor

Change directory into the new folder and open the project inside VS Code with the following commands:

cd gChartRazor 

code .

We will need to install an Entity Framework command-line utility. If you have not done so already, install dotnet-ef with this command:

dotnet tool install –g dotnet-ef 

It does not hurt to upgrade this tool to the latest version with:

dotnet tool update -g dotnet-ef

Also, from within the root folder of your project, add some SQL-Server and Entity Framework related packages with the following terminal-window commands:

dotnet add package Microsoft.EntityFrameworkCore.Design
dotnet add package Microsoft.EntityFrameworkCore.SqlServer
dotnet add package Microsoft.EntityFrameworkCore.Tools

In appsettings.json, add this to ConnectionStrings block just before “Logging”:

"ConnectionStrings": {
    "NW": "Data Source=localhost,1444;Initial Catalog=Northwind;Persist Security Info=True;User ID=sa;Password=Passw0rd2018"
},

Next, let us reverse engineer the Products Categories entities in the Northwind database. Execute this command from the root of your project:

dotnet-ef dbcontext scaffold "Data Source=localhost,1444;Initial Catalog=Northwind;Persist Security Info=True;User ID=sa;Password=Passw0rd2018" Microsoft.EntityFrameworkCore.SqlServer -c NorthwindContext -o NW --table Products --table Categories

This creates a NW folder in your project with entities Category Product. It also adds the database context class NorthwindContext.


Delete the OnConfiguring() method in NorthwindContext.cs so that there is no hard-coded connection string in our C# code.

Add the following code to Program.cs right after where the variable builder is declared:

var connectionString = builder.Configuration.GetConnectionString("NW");
builder.Services.AddDbContext<NorthwindContext>(options => {
  options.UseSqlServer(connectionString);
});

Reading data

In the Pages folder, add two files ChartData.cshtml and ChartData.cshtml.cs.

Content of ChartData.cshtml is:

@page
@model ChartDataModel

Content of ChartData.cshtml.cs is:

using gChartRazor.NW;
using Microsoft.AspNetCore.Mvc;
using Microsoft.AspNetCore.Mvc.RazorPages;
using Microsoft.EntityFrameworkCore;

namespace gChartRazor.Pages;

public class ChartDataModel : PageModel {
   private readonly ILogger<ChartDataModel> _logger;
   private readonly NorthwindContext _northwindContext;

   public ChartDataModel(ILogger<ChartDataModel> logger, NorthwindContext northwindContext) {
     _logger = logger;
     _northwindContext = northwindContext;
   }

   public async Task<JsonResult> OnGet() {
     var query = await _northwindContext.Products
     .Include(c => c.Category)
     .GroupBy(p => p.Category!.CategoryName)
     .Select(g => new
     {
         Name = g.Key,
         Count = g.Count()
     })
     .OrderByDescending(cp => cp.Count)
     .ToListAsync();

     return new JsonResult(query);
   }
}

The above code in ChartData.cshtml.cs returns a JSON array with data from the Northwind database representing the number of products in each category.

At this stage, let's run our web application and verify that we are indeed able to read data from the Northwind database and subsequently generate JSON data. Run your application with:

dotnet watch run

Point your browser to https://localhost:7108/chartdata

NOTE: you will need to adjust the port number to suit your environment.

This is what was revealed in my browser:


We have a sense of assurance that our data is ready to be displayed in a chart.

Charting the data

Replace your Pages/Index.cshtml with the following code:

@page
@model IndexModel
@{
    ViewData["Title"] = "Home page";
}

<title>@ViewData["Title"] - Google Charts</title>  
<script type="text/javascript" src="https://www.gstatic.com/charts/loader.js"></script>  
  
<div id="column_chart_div"></div>  
<div id="line_chart_div"></div>  
<div id="pie_chart_div"></div>  
<div id="area_chart_div"></div>  
<div id="bar_chart_div"></div>  
<script type="text/javascript">  
  
   google.charts.load('current', {  
     packages: ['corechart', 'bar']  
   });  
   google.charts.setOnLoadCallback(LoadData);  
   function LoadData() {  
      $.ajax({  
         url: '/ChartData',  
         dataType: "json",  
         type: "GET",  
         error: function(xhr, status, error) {  
            toastr.error(xhr.responseText);  
         },  
         success: function(data) {  
            PopulationChart(data, "column-chart");  
            PopulationChart(data, "line-chart");  
            PopulationChart(data, "pie-chart");  
            PopulationChart(data, "area-chart"); 
            PopulationChart(data, "bar-chart"); 
            return false;  
         }  
      });  
      return false;  
   }  
   function PopulationChart(data, chart_type) {  
      var dataArray = [  
         ['Category', 'Product']  
      ];  
      $.each(data, function(i, item) {  
         dataArray.push([item.name, item.count]);  
      });  
      var data = google.visualization.arrayToDataTable(dataArray);  
      var options = {  
         title: 'Product count by category',  
         chartArea: {  
             width: '80%'  
         },  
         colors: ['#b0120a', '#7b1fa2', '#ffab91', '#d95f02'],  
         hAxis: {  
             title: 'Categories',  
             minValue: 0  
         },  
         vAxis: {  
             title: 'Product Count'  
         }  
      };  
      var chart;
      switch(chart_type) {
         case "line-chart":
            chart = new google.visualization.LineChart(document.getElementById('line_chart_div'));  
            break;
         case "pie-chart":
            chart = new google.visualization.PieChart(document.getElementById('pie_chart_div'));  
            break;
         case "area-chart":
            chart = new google.visualization.AreaChart(document.getElementById('area_chart_div'));  
            break;
         case "bar-chart":
            chart = new google.visualization.BarChart(document.getElementById('bar_chart_div'));  
            break;
         default:
            chart = new google.visualization.ColumnChart(document.getElementById('column_chart_div'));  
            break;
      }
      chart.draw(data, options);  
      return false;  
   }  
</script>    

If you point your browser to the home page, you should see five charts, namely: column, line, pie, area and bar charts.


Conclusion

I trust the above article helps you consider using Google Charts with ASP.NET Razor Pages to visually display data.